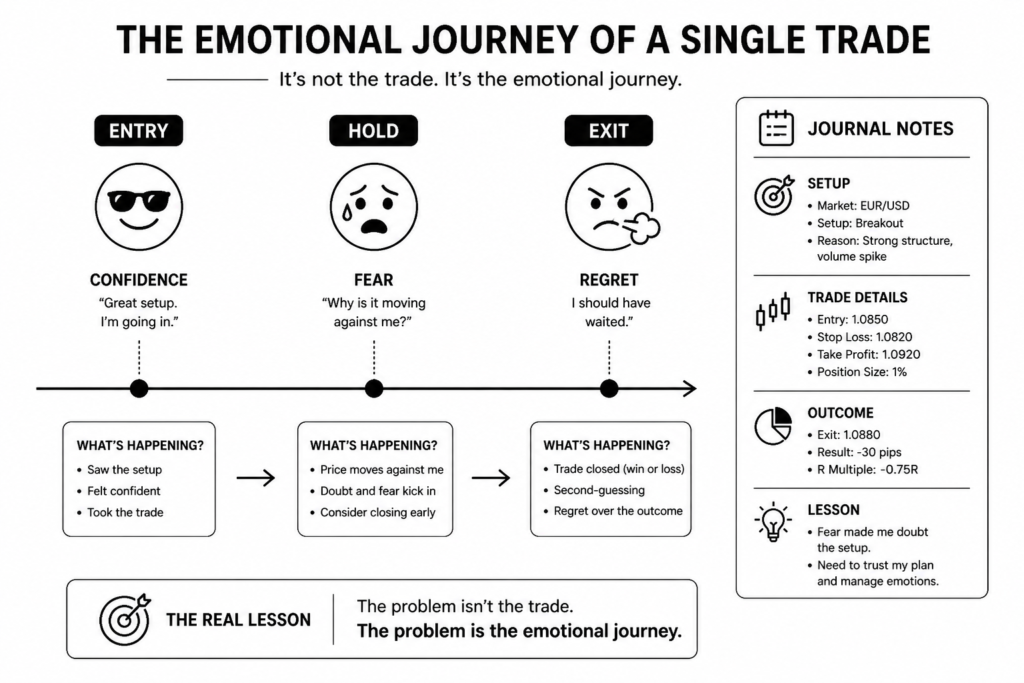
Most traders who keep a trading journal are only using half of it. They record entry and exit prices, position size, outcome, and maybe a brief note on the setup. The numbers are there. The performance data is there. But the layer underneath those numbers, the emotional state that drove the decision, the psychological pattern that caused the stop loss to move, the impulse that triggered the re-entry thirty seconds after a loss, that layer is missing entirely.
This matters because numbers tell you what happened. They do not tell you why it happened. And in trading, why is almost always where the real problem lives. A strategy that backtests profitably but underperforms in live trading is not usually failing because the market changed. It is usually failing because the trader’s psychological state is changing the execution in ways that are invisible without a written record.
A trading journal used correctly is one of the most powerful psychological tools available to a retail trader. Not because it provides therapy or insight in some abstract sense, but because it provides data. Objective, timestamped, unedited data on the decisions you made and the emotional state you were in when you made them. Memory cannot be trusted for this purpose. Emotions distort recollection within minutes of a trade closing, and the version of events your brain reconstructs an hour later is already partially rationalised, already slightly more logical and deliberate than what actually happened. A journal written in real time captures the truth. A memory reviewed later captures a cleaner, more flattering version of it.
If you are new to trading journals and want a full breakdown of what they are, what they should contain, and how to set one up, our complete trading journal guide covers all of that in detail. This article is specifically for traders who already understand what a journal is and want to use it as a structured tool for psychological development and emotional pattern recognition rather than just a record of trades and outcomes.
Key Takeaways
- Most traders use their journal as a performance log and miss the psychological layer that explains why results look the way they do.
- A trading journal is a psychology tool because it creates objective, real-time data on emotional states and decisions that memory cannot reliably reconstruct after the fact.
- This article covers the specific emotions that belong in a trading journal, how to track emotional state consistently, how to identify psychological patterns in journal data, and how to use those patterns to break specific destructive behaviours.
- Building a structured psychological review routine around the journal, daily, weekly, and monthly, is what turns raw emotional data into measurable behavioural change over time.
- TradingJournalReviews.com helps traders find journal platforms with dedicated psychology tracking features so the tool matches the goal from the start.
Why a Trading Journal Is a Psychology Tool First
A trading journal is a psychology tool that also tracks performance, not a performance tracker that occasionally captures psychology. This distinction matters because it changes how you use it. A trader who approaches the journal as a performance log fills in the numbers and moves on. A trader who approaches it as a psychological record fills in the numbers and then asks why those numbers look the way they do, which is the question that actually produces improvement.
The deepest value a trading journal provides is not the win rate calculation or the equity curve. It is the objective, timestamped record of decisions and emotional states that existed at the moment each trade was taken. That record cannot be edited after the fact. It cannot be rationalised away. It cannot be unconsciously improved by a brain that prefers to remember itself as more disciplined and deliberate than it actually was. It is simply what happened, written down at the time it happened, available for review exactly as it was recorded.
This matters because of how quickly emotions distort memory after a trade closes. Research on memory and emotional experience consistently shows that the brain reconstructs past events rather than replaying them accurately, and that emotionally charged experiences, which every significant trading decision qualifies as, are particularly vulnerable to post-hoc rationalisation. A trader who moved their stop loss out of fear will remember, within an hour, that they moved it because the market structure had changed. A trader who entered a revenge trade out of frustration will remember it as a second read on the setup. A trader who exited a winner early out of anxiety will remember being cautious and disciplined. None of these reconstructions are deliberate dishonesty. They are simply how memory works under emotional pressure.
Without a journal entry written at the time, there is no way to challenge these reconstructions. The trader reviews a version of their behaviour that is already cleaner, more rational, and more flattering than what actually occurred, draws conclusions from that sanitised version, and wonders why the same mistakes keep happening despite their awareness of them. The journal breaks this cycle by preserving the unedited version. It is the only record of what you actually did and how you actually felt when you did it, and it is therefore the only reliable foundation for understanding and changing your own behaviour as a trader.
The Emotions That Belong in Your Trading Journal
Every emotion that influences a trading decision belongs in the journal. Not as a lengthy confession or a therapeutic exercise, but as a brief, honest label recorded at the time of the trade. The entries themselves take seconds. The patterns they reveal over weeks and months are worth far more than any technical indicator a trader could add to their chart.
Fear
Fear is the most common emotion in trading and one of the hardest to recognise in the moment because it rarely announces itself as fear. It arrives as a sense that the trade is not quite right, a hesitation before entry on a valid setup, an urge to move the stop closer to entry or exit before the target is reached.
In the trading record, fear leaves specific footprints. Premature exits appear as trades closed well before the planned take profit level with no change in market structure to justify the decision. Missed setups appear as valid entries that were identified, prepared, and then not taken. Stop losses moved toward entry rather than away from it appear as a position size adjustment mid-trade that has no analytical basis. When you notice any of these in your data, fear is almost always the explanation.
When fear is the dominant emotion during a trade, write it down immediately. Note what the fear was specifically, fear of giving back profit, fear of a news event, fear that the setup was wrong despite meeting all criteria. During weekly review, filter for entries where fear was recorded and look at the outcomes. Most traders discover that their fear-driven exits and missed entries represent a significant portion of their total lost edge, money left on the table not by the market but by their own psychological state.
Greed
Greed in trading does not usually feel like greed. It feels like conviction. It feels like reading the market correctly and pressing the advantage. This is what makes it difficult to catch in real time and why the journal is essential for identifying it after the fact.
In the trading record, greed appears in specific and measurable ways. Position sizes that are larger than the standard risk rule allows, recorded in the size field, reveal where the trader decided their conviction justified extra exposure. Take profit targets that were removed mid-trade and replaced with a trailing approach or no target at all indicate a decision made under the influence of wanting more rather than following the plan. Re-entries logged within minutes of a winning trade closing, without a new setup forming, show the pattern of wanting to stay in a winning market beyond what the strategy supports.
Across a large sample of trades, greed-driven entries typically show a specific profile: higher than average position size, longer than average hold time, and a wider than average variance in outcome. Some produce outsized wins that feel like confirmation of the approach. But the average outcome across all greed-flagged entries is almost always worse than the overall trading average, which is the data point that makes the pattern impossible to dismiss.
Frustration and Revenge Impulse
Frustration after a loss is a normal human response. Acting on it is where the damage occurs. The journal’s role in managing this emotion is not to prevent frustration but to create enough awareness of it that the gap between feeling frustrated and placing the next trade widens enough for the impulse to pass.
Logging emotional state immediately after a losing trade is the critical step. This entry does not need to be detailed. Writing frustrated or angry next to the losing trade, and then recording the same state or a calmer one next to whatever trade follows, creates the data needed to identify whether a revenge pattern exists in the record. When multiple losses in a row are followed by trades that do not meet setup criteria, that were sized larger than standard, or that were entered within minutes of the previous loss closing, the journal is showing you the revenge trading cycle in your own data.
During review, look specifically at the trades that follow a loss. Compare their setup quality rating, position size, and outcome against your overall trading average. The gap between these figures and the overall average is the measurable cost of trading while frustrated, and it is often the single most compelling piece of data for a trader who has been resistant to accepting that emotion is affecting their results.
FOMO
Fear of missing out produces a specific and recognisable trade profile that is almost always visible in the journal data once you know what to look for. FOMO entries happen when price has already moved significantly from the logical entry point and the trader enters anyway because the move looks strong and sitting out feels worse than participating at a poor location.
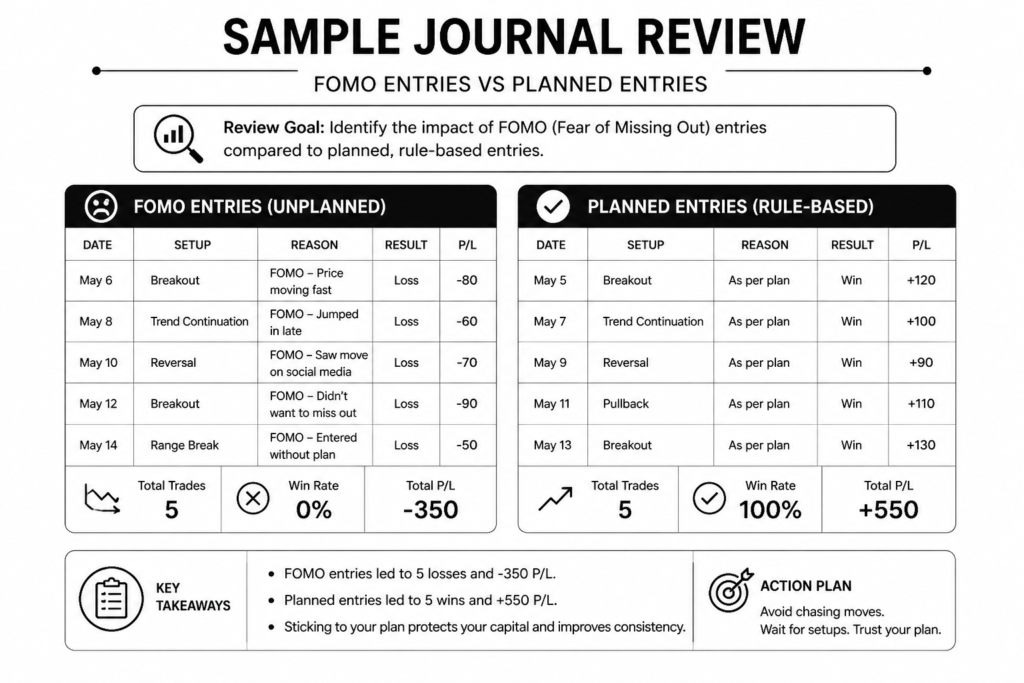
In the journal, FOMO trades appear as entries logged well after the setup triggered, with entry prices that are meaningfully worse than the planned entry level. The stop loss field on these entries is often blank, set to an unusually wide level, or placed at an arbitrary round number rather than at a logical market structure point, because the original risk reference was left behind when price moved away from it. The setup name field on FOMO entries often contains a valid setup name that does not accurately describe what was actually traded, because the trader labelled the entry with the setup they wished they had taken rather than the impulse entry they actually made.
Across a sample of trades, FOMO entries typically show a worse average risk-reward ratio, a lower win rate, and a higher incidence of maximum adverse excursion hitting the stop quickly after entry, because the entry location was poor from the start. Reviewing these entries side by side with planned entries on the same instrument and setup is often enough to make the FOMO pattern feel genuinely costly rather than just theoretically inadvisable.
Overconfidence
Overconfidence is the most dangerous psychological state in trading precisely because it feels like its opposite. After a winning streak, the trader who is most at risk of a significant drawdown is the one who feels most in control of the market. The journal catches this pattern through the data rather than through self-awareness, which is why it matters so much during periods of strong performance.
The overconfidence pattern in journal data typically develops gradually over a sequence of winning trades. Position sizes recorded in the size field begin to creep upward from the standard risk amount. The setup quality rating, if the trader is using one, begins to include lower-scoring entries that would have been passed over earlier. The post-trade notes section, which should be equally detailed regardless of outcome, becomes shorter and less analytical as the trader stops questioning decisions that are producing wins.
These shifts are almost invisible trade by trade. They only become clear when reviewing a sequence of entries side by side. Looking at position size across the last twenty trades on a chart or sorted database view, watching it trend upward through a winning run, is often the clearest possible demonstration of what overconfidence looks like in practice and what it sets up. The large position taken at peak confidence is almost always the one that catches the reversal.
Boredom
Boredom is the least discussed trading emotion and one of the most consistently expensive. It does not appear in most conversations about trading psychology because it lacks the drama of fear or greed, but in the journal data of traders who are honest enough to record it, boredom-driven entries are a reliable source of unnecessary losses.
Boredom trades have a specific profile. They occur during low-volatility periods when the market is not offering valid setups but the trader is at the desk and wants to be active. They appear on instruments outside the defined watchlist because the trader started browsing for something that was moving when their primary markets were quiet. The setup name field on these entries is vague or absent because there was no genuine setup, only a desire to participate in something.
The most revealing review exercise for boredom trading is to filter journal entries by the time of day they were taken and look at which sessions produce the highest proportion of below-criteria setups. Most traders find that their boredom trades are concentrated in specific windows, often mid-session lulls or the hour before a major session opens, and that removing or significantly reducing activity during those windows would eliminate a disproportionate share of their losing trades. That is a data-driven session management decision that the journal makes possible.
How to Track Emotional State in Your Journal
Knowing which emotions affect your trading is only useful if you record them accurately and consistently enough to analyse. Most traders who attempt emotional tracking either record it too infrequently, reconstruct it from memory hours after the fact, or use such varied language across entries that the data cannot be compared meaningfully over time. The three practices below address each of these problems directly.
What to Record and When
Emotional state should be recorded at three specific points in every trading session, not once at the end of the day and not only when something goes wrong.
Before the session. Before placing any trade, write a single word or short phrase describing your baseline emotional state for the day. This is not a mood diary entry. It is a data point. Calm, tired, anxious, distracted, confident, and stressed are all sufficient. This baseline matters because it establishes the psychological starting condition for everything that follows. A session that begins with a baseline of stressed or distracted should already be flagged as higher risk before a single trade is placed, and reviewing baseline states against session outcomes over time reveals whether your starting emotional condition predicts your trading quality in a statistically meaningful way.
At the point of entry. At the moment you decide to enter a trade, before clicking the button, write one word describing what you are feeling. This is the most important of the three recording points because it captures the emotional state that directly influenced the decision to enter. It takes five seconds and it is the entry that most traders skip because they are focused on execution. That five-second record is where the most valuable psychological data in the entire journal lives.
Immediately after the trade closes. As soon as a position closes, before looking at the next setup or checking other charts, write one word describing your emotional state. This captures the reaction to the outcome, which is the state most likely to influence the next decision. A closing emotional state of frustrated or relieved or euphoric recorded immediately after a trade tells you something specific about how that outcome affected your psychological readiness for whatever comes next.
All three recordings should be completed in real time. Reconstructed emotional states written at the end of the session are already filtered through memory and outcome knowledge. A trade that produced a loss will be remembered as having felt more anxious than it actually did. A winner will be remembered as having felt more confident. Real-time recording is the only version that is reliable enough to analyse.
Using a Fixed Emotional Vocabulary
Free-text emotional state entries create a problem that only becomes visible when you try to analyse them. If one entry says anxious, another says a bit nervous, a third says unsettled, and a fourth says not feeling great about this one, these are all describing the same underlying state but they appear as four separate categories in any filter or grouping exercise. The pattern is invisible because the language is inconsistent.
The solution is to define a fixed emotional vocabulary before you start logging and use it consistently for every entry. The list does not need to be long. A set of eight to twelve labels covers the full range of states most traders experience:
- Calm
- Confident
- Anxious
- Frustrated
- Euphoric
- Impatient
- Bored
- Distracted
- Tired
- Revenge
- FOMO
- Uncertain
Choose the label from the list that most closely matches your state at the recording point and write only that word. If you are using a digital journal with a select property, configure these as the only available options so the field cannot contain anything else. If you are using a notebook, write the list on the inside cover for reference.
Once your entries use consistent labels, emotional state becomes a genuinely filterable and analysable data point. You can group all trades logged under frustrated and compare their aggregate outcome against your overall average. You can look at all sessions with a baseline of tired and see whether your win rate on those days differs meaningfully from sessions that started with calm or confident. You can identify which emotional states at entry correlate with your best and worst trade outcomes. None of this analysis is possible when the vocabulary is inconsistent across entries.
Rating Trade Quality Separately from Outcome
Outcome and process quality are two different things, and treating them as the same thing is one of the most common and most damaging mistakes in trading journal practice. A trade can follow the plan perfectly and produce a loss due to random market movement. A trade can break every rule and produce a profit for the same reason. If you evaluate your trading based on outcomes alone, the feedback signal is corrupted by randomness and you cannot learn accurately from your record.
Rating each trade on process quality, independently of whether it made or lost money, creates a second data layer that separates the quality of your decision from the quality of the result. A simple three or five point scale is sufficient. A rating of three out of three or five out of five means the trade met all entry criteria, was sized correctly, had a defined stop and target in place before entry, and was managed according to plan. A rating of one out of three means one or more of those conditions was not met.
The analysis that this rating enables over a large sample is one of the most valuable exercises available in trading journal practice. Specifically:
- If high process quality trades are profitable on average and low process quality trades are not, your strategy has edge and your execution is the variable to improve.
- If high process quality trades are also losing on average, the strategy itself needs examination regardless of how disciplined the execution has been.
- If low process quality trades are profitable on average, the sample needs to grow before drawing conclusions, but it is worth examining whether the defined criteria are actually capturing the edge or whether the real edge lies somewhere else.
Comparing process quality ratings against emotional state at entry adds a further layer. Most traders find that their lowest quality process ratings are clustered around specific emotional states, typically frustrated, impatient, FOMO, or bored, which closes the loop between the psychological tracking and the performance data in a way that makes the connection between emotion and outcome impossible to dismiss.
How to Identify Psychological Patterns in Your Journal Data
Individual trade entries are raw material. The pattern recognition happens when you step back from individual entries and look at sequences, clusters, and trends across a larger sample. This is the work that turns a journal from a record into a development tool, and it happens primarily in the review process rather than in the logging process.
The Weekly Review as a Pattern Recognition Tool
A single journal entry tells you what happened in one trade. Ten entries reviewed together start to suggest tendencies. Forty entries reviewed across a month reveal patterns that are reliable enough to act on. The weekly review is the structured moment where this pattern recognition work happens, and approaching it with specific psychological questions rather than just scrolling through entries is what makes it productive.
During the weekly review, look specifically for the following:
Clusters of the same emotional state preceding losses. Sort or scan your entries for the emotional state recorded at entry and look at what follows. If the majority of your frustrated or impatient entries are followed by losses or below-average outcomes, that is not coincidence after a sufficient sample size. It is a measurable relationship between a specific emotional state and degraded decision quality that your data is showing you directly.
Specific sessions or times of day where emotional control breaks down. Look at when your lowest process quality ratings and your most emotionally flagged entries occur. Many traders find that their psychological discipline deteriorates during a specific window, the last hour of the session when fatigue sets in, the period immediately after lunch, or the first thirty minutes after a significant loss. Identifying the window is the first step to either avoiding it or approaching it with additional protective rules.
Sequences that suggest a revenge or overconfidence cycle is underway. Look for trade sequences where position size increases across consecutive entries without a corresponding increase in setup quality rating. Look for sequences where a loss is immediately followed by one or two trades logged with frustrated or revenge as the emotional state. These sequences are the signature of the two most destructive psychological cycles in retail trading, and they are far easier to see in a sequence of ten entries reviewed together than in any individual entry reviewed in isolation.
The weekly review should not just identify these patterns. It should produce a specific written note in the journal about what was found and what rule or behaviour adjustment will be carried into the following week. A pattern identified but not acted on is still just data. The review is only complete when it produces a decision.
Spotting Your Specific Trigger Events
Every trader has specific trigger events that predictably produce destructive psychological responses. These triggers are individual. What sends one trader into a revenge trading spiral has no emotional effect on another. What produces paralysing fear in one trader produces calm analytical thinking in another. Generic advice about managing emotions in trading cannot identify your specific triggers. Only your own journal data can do that.
The journal reveals trigger events by showing what precedes your worst psychological entries. Review the entries that carry your most destructive emotional state labels, frustrated, revenge, FOMO, overconfident, and look at what the entry immediately before them shows. Over a large enough sample, specific preceding events will appear with disproportionate frequency. Common triggers that appear in trader journal data include:
- A stop loss hit at a price level that the trader felt certain would hold, creating not just a loss but a sense of the market being wrong or unfair
- A setup identified and prepared but not entered due to hesitation, followed by watching price move significantly in the anticipated direction without a position
- A session that begins with a loss on the first trade, which sets a negative emotional baseline that colours every subsequent decision in that session
- A drawdown that crosses a psychologically significant threshold, such as a round number loss or a new low in account equity, regardless of whether the drawdown is within the statistical range of the strategy
Once you have identified your specific triggers from your own data, you can build specific rules around them. A trader who knows from their journal that a stop loss hit at a felt-certain level reliably produces a revenge trade can institute a mandatory fifteen-minute break after any stop loss hit before any new trade is considered. A trader who knows that a losing first trade sets a negative session baseline can implement a rule that allows only one trade in the first thirty minutes of a session. These rules are not generic psychological advice. They are personalised interventions built from your own evidence.
Measuring the Cost of Emotional Trades
For traders who intellectually accept that psychology affects their trading but have not fully internalised it as a priority, calculating the financial cost of their emotional trades is often the single most effective reframe available. Numbers have a way of making abstract concepts concrete.
The calculation is straightforward. Filter your journal for all entries where a destructive emotional state was recorded at entry. This includes any entry logged with frustrated, revenge, FOMO, impatient, bored, or overconfident, depending on which labels your fixed vocabulary includes. Calculate the aggregate outcome of these entries in monetary terms. Then compare that figure against two reference points: your overall trading outcome for the same period, and what your overall outcome would have been if those entries had simply not been taken.
Most traders who run this calculation for the first time find one of two results. Either the emotional trades are responsible for a disproportionate share of their total losses, meaning that removing them would have made a losing period breakeven or profitable. Or the emotional trades are producing a net negative outcome that is dragging down an otherwise profitable strategy, meaning that the strategy has genuine edge but psychology is eroding it.
Both findings are valuable but the second is often the more motivating, because it reframes the psychological work not as personal development in an abstract sense but as a concrete performance improvement with a specific and calculable financial value. A trader who can see that their emotional entries cost them a specific amount over three months has a precise number to put against the effort required to address the pattern. That number tends to make the effort feel considerably more worthwhile than it did when psychology was just a concept rather than a line item in the trading record.
Using Journal Insights to Break Specific Psychological Patterns
Identifying a psychological pattern in your journal data is the first step. The second step, the one most traders stop short of, is translating that identification into a specific rule change that interrupts the pattern before it plays out. Awareness without a structural intervention rarely produces lasting behaviour change. The journal gives you the evidence. What you do with it determines whether that evidence becomes improvement or just an interesting observation about yourself that repeats indefinitely.
Breaking the Revenge Trading Cycle
The revenge trading pattern has a consistent signature in journal data. A loss is followed within a short time window by one or more trades that carry a lower process quality rating than average, a larger than standard position size, or an emotional state label of frustrated or revenge at entry. The outcome of these follow-on trades is typically worse than the overall trading average, which produces another loss, which can trigger another cycle.
The journal identifies this pattern by making the sequence visible. Once you can see from your own data that a specific percentage of your losses in a given period were generated in the trades immediately following another loss, the pattern is no longer deniable and the cost of it is calculable.
The intervention that works is structural rather than motivational. Telling yourself to stay disciplined after a loss does not work reliably because the frustration that drives revenge trading bypasses rational intention. A rule that removes the option works better. Specific rules that traders derive from their journal data include:
- A mandatory cooling-off period of a defined length, typically fifteen to thirty minutes, after any loss that exceeds a defined threshold, during which no new trade can be entered regardless of what the market is doing
- A maximum of one re-entry per session after a stop loss is hit, with the re-entry only permitted if the new setup meets all criteria at the standard position size
- A hard session stop after two consecutive losses, treating the trading day as finished regardless of how much time remains in the session
The specific rule matters less than the fact that it is written down, pre-committed, and treated as completely non-negotiable. A rule that can be overridden by a sufficiently strong impulse is not a rule. It is a suggestion, and suggestions do not interrupt psychological cycles.
Managing FOMO With Journal Evidence
FOMO is particularly resistant to management through willpower because it feels urgent in the moment. The move is happening now. Every second without a position feels like a loss being confirmed. The rational awareness that the entry location is poor does not compete effectively against the visceral discomfort of watching price move without a trade on.
What does compete effectively is your own data reviewed in advance of the impulse. Before FOMO strikes in real time, you already know from your journal what your FOMO entries have produced historically. You know their average outcome, their average setup quality rating, their average risk-reward ratio achieved versus planned, and how they compare against your planned entries on the same setups. That knowledge, internalised from repeated review rather than encountered for the first time in the heat of the moment, changes the psychological weight of the decision.
The practical approach is to run a specific FOMO review during your weekly session. Filter all entries logged with FOMO as the emotional state at entry and calculate the following figures: win rate, average monetary outcome, average process quality rating, and average outcome compared to your overall trading average. Write these figures somewhere visible, on a sticky note on your monitor, in the notes section of your trading plan, or at the top of your weekly review page. These numbers are your evidence against the impulse. They transform FOMO from a feeling you are fighting with willpower into an argument you are countering with data, which is a significantly more effective contest.
Controlling Overconfidence After Winning Streaks
Overconfidence is the only destructive psychological pattern that is actively reinforced by recent positive results, which is what makes it so difficult to catch through self-awareness alone. The trader feels best about their ability at exactly the point where their risk-taking is becoming most dangerous. The journal catches it not through how the trader feels but through what the data shows.
Tracking position size as a data point across consecutive entries reveals the overconfidence escalation pattern clearly. When reviewed on a chart or sorted list, a gradual upward trend in position size across a sequence of winning trades is the most reliable early indicator of overconfidence in the record. The trader rarely notices this trend trade by trade because each individual size increase feels justified by recent performance. The sequence viewed together makes the escalation obvious.
The structural intervention is a hard position size cap expressed as a fixed percentage of account equity that cannot be exceeded regardless of recent performance, recent confidence, or any other variable. This rule works because it removes position sizing from the domain of real-time judgment entirely. There is no decision to make. The size is the size. Recent results do not change it.
Some traders add a secondary rule that requires position size to return to the standard level at the start of each new trading week regardless of how the previous week ended, preventing winning streak momentum from carrying forward into a new period at an elevated risk level. Both rules are derived from the same journal observation: that position size escalation after wins is a measurable and costly pattern, and that removing discretion from sizing decisions during those periods is the most reliable way to interrupt it.
Reducing Overtrading Through Session Data
Overtrading is almost always concentrated rather than evenly distributed across a session. Most traders who overtrade do not do it consistently throughout every hour of every day. They do it in specific windows, under specific conditions, and the journal data shows exactly where those windows are once you filter for it.
The analysis involves two filters applied to the trade log simultaneously: time of entry and trade number within the session. Running these filters across a month or more of data typically reveals one or more of the following patterns:
- A spike in below-criteria entries during a specific hour of the session when the market is quiet and the trader is sitting at the desk with nothing valid to trade
- A deterioration in process quality rating on trades taken after the third or fourth entry in a session, suggesting that decision quality degrades with session length for that particular trader
- A concentration of boredom-flagged entries during the period between two major sessions when volatility drops and valid setups become scarce
Once the pattern is visible in the data, the intervention is session-based rather than willpower-based. A trader who discovers from their journal that their process quality collapses on trades taken after 2pm can set a hard close to their trading day at that time. A trader who finds that their worst trades are consistently the fourth or fifth of the session can implement a maximum of three trades per session rule. A trader who identifies a specific low-volatility window as the source of most of their boredom entries can step away from the desk during that window rather than sitting in front of a market that is not offering anything worth taking.
These are not arbitrary rules imported from trading books or online forums. They are personalised session management decisions built directly from the trader’s own data, which is what makes them both more accurate and more credible to the trader who has to follow them.
Building a Psychological Review Routine Around Your Journal
Recording emotional state in real time creates the data. The review routine is what turns that data into insight and insight into behaviour change. Without a structured review process, even the most honest and detailed emotional logging produces nothing more than a collection of labels that sit unexamined in the journal. The three review layers below operate at different time horizons and serve different purposes, but together they create a complete psychological feedback loop around the trading practice.
The Daily Post-Session Review
The daily post-session review is the shortest of the three review processes and the one most traders skip because it feels unnecessary after a session that went well or too painful after one that did not. Both of these are reasons to do it rather than reasons to skip it. A session that went well still contains psychological data worth examining. A session that went badly is precisely when the review is most valuable, because the emotional state is still fresh and the patterns are still visible before memory begins to edit them.
The daily review should take no more than ten minutes and should focus specifically on the psychological layer rather than the performance numbers. Cover the following in sequence:
Which emotions were present during the session. Look back at the emotional state fields recorded before the session, at each entry, and after each close. Note whether any pattern is already visible within a single day, a cluster of the same state across multiple entries, a baseline emotional state that shifted during the session, or a closing state on one trade that matches the entry state on the next.
Whether any rules were broken and what the emotional state was at the time. For every trade rated below the top process quality score, identify which rule was not followed and what the emotional state field shows for that entry. This connection between the rule break and the emotional state is the core data point of the daily review. Over time, the same emotional state will appear repeatedly next to the same rule breaks, which is the pattern the weekly review then confirms across a larger sample.
What to carry forward into the next session. Write one or two sentences at the end of the daily review noting the main psychological observation from the session and one specific intention for the next session. This intention should be concrete and behavioural rather than motivational. Not trade with more discipline but if I log frustrated at entry, I will close the journal and step away from the desk for fifteen minutes before reconsidering. The intention creates a pre-commitment that is easier to honour than a general resolution made under no particular pressure.
The Weekly Pattern Review
The weekly pattern review is where individual daily observations become statistically meaningful. A single day’s data can show a coincidence. A full week’s data begins to show a tendency. The psychological section of the weekly review should be treated as a distinct exercise within the broader weekly review process, with its own structured questions rather than a general scan through the week’s entries.
Work through the following questions during the weekly psychological review:
What was the dominant emotional state across the week’s entries. Count the frequency of each emotional label across all entry-point recordings for the week. The most frequently appearing label is the psychological tone of the week, and comparing this across consecutive weeks reveals whether emotional baseline is stable, improving, or deteriorating over time.
Were there any emotional trends within the week. Look at whether emotional states at entry changed across the trading days of the week. Many traders find that their psychological state is most stable on Monday and Tuesday and most vulnerable on Thursday and Friday, when accumulated fatigue and the pressure of a week’s results combine. Others find the opposite. The weekly view across five days of entry-point recordings reveals this intraweek pattern in a way that the daily review cannot.
Were there any trigger events and what followed them. Identify any event during the week that was followed by a cluster of emotionally-flagged entries. A large loss on Tuesday morning followed by a sequence of revenge-labelled entries through Tuesday afternoon is a trigger event and its consequence, visible in the weekly sequence in a way that the daily review on Tuesday might have partially captured but the weekly view makes unmistakable.
Did any of last week’s psychological intentions carry through into behaviour. Review the intentions written at the end of each daily post-session review during the week. For each intention, look at whether the journal data shows evidence of it being followed or not. This is the accountability layer of the review routine, the moment where stated intentions are tested against recorded behaviour rather than evaluated on the basis of how disciplined the trader felt.
Close the weekly psychological review with a written note identifying the single most important pattern observed during the week and the specific rule or behaviour adjustment that will be carried into the following week. One specific change acted on consistently produces more improvement than five observations that remain at the level of awareness.
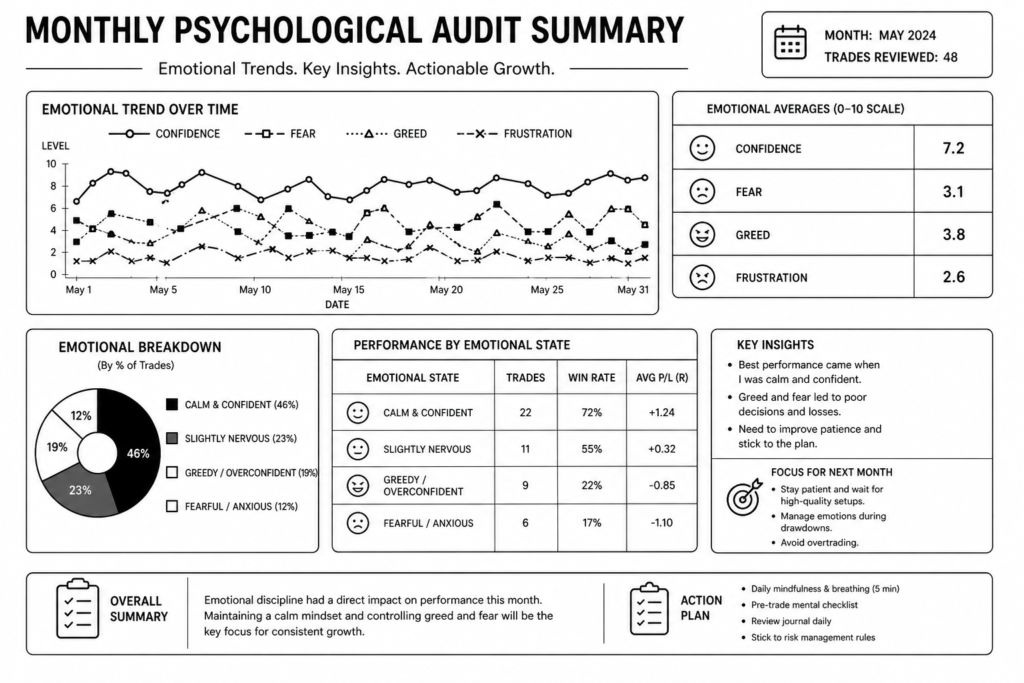
The Monthly Psychological Audit
The monthly psychological audit operates at a longer time horizon than the daily and weekly reviews and serves a different purpose. Where the daily review captures immediate patterns and the weekly review identifies within-week tendencies, the monthly audit answers the question that matters most for long-term development: is my trading psychology actually improving over time, or am I identifying the same patterns month after month without measurable progress?
The monthly audit should be approached as a structured analysis rather than a narrative review. Work through the following:
Frequency of destructive emotional state labels over the month compared to the previous month. Count the total number of entries logged with each destructive emotional label across the full month. Compare these counts against the previous month’s equivalent figures. A reduction in the frequency of a specific label that was identified as a target pattern in the previous month’s audit is measurable psychological improvement. An increase, or no change, is a signal that the intervention implemented has not been effective and needs to be revised.
Cost of emotional trades over the month compared to the previous month. Run the emotional trade cost calculation described in the pattern identification section for the full month’s data. Compare the result against the previous month. If the financial cost of emotionally-driven trades is decreasing month over month, the psychological development work is producing a measurable outcome. If it is stable or increasing, the work is not yet translating into behaviour change at the execution level.
Process quality rating distribution over the month compared to the previous month. Calculate the average process quality rating across all trades for the month and compare it against the previous month’s average. A rising average process quality rating over consecutive months is one of the clearest indicators that psychological discipline is improving in practice rather than just in intention.
Whether trigger events are producing smaller or shorter destructive sequences. Review the trigger events identified during the month’s weekly reviews and look at how many trades followed each trigger event before emotional state returned to baseline. If the sequences are getting shorter over time, the pre-committed rules are working. If they are the same length or longer, the rules need strengthening or the triggers need to be addressed more directly.
Write the monthly audit findings as a structured summary with four sections mirroring the analysis above, followed by a clear statement of the two or three psychological priorities for the coming month. These priorities feed directly into the daily and weekly review intentions for the next month, closing the feedback loop between the long-term audit and the short-term review practice.
How TradingJournalReviews.com Helps You Find a Journal Built for Psychology
Not all trading journals treat psychology as a core feature. Some platforms are built primarily as performance trackers, focusing on quantitative data, broker integration, and analytics dashboards, with emotional state tracking added as an afterthought, a single optional text field that cannot be filtered, grouped, or analysed in any meaningful way. Others are built with psychological development as a central design principle, with dedicated emotional state fields using fixed vocabulary, process quality ratings, behavioural pattern reporting linked to emotional data, and review templates specifically structured around the psychological layer of the trading record.
The difference between these two approaches is not a minor feature distinction. If you are using your journal as a psychological development tool in the way this article describes, a platform that treats emotional tracking as an optional text box fundamentally cannot support the work. You cannot filter by emotional state if the field is free text and inconsistent. You cannot generate behavioural pattern reports if the platform does not recognise emotional data as an analysable variable. You cannot measure the cost of emotional trades if the platform has no mechanism for grouping entries by psychological category. The tool either supports the methodology or it does not, and discovering that it does not after several months of logging is an expensive and frustrating way to find out.
Choosing the right journal platform for psychological tracking requires evaluating specific features that are not always prominent in a platform’s marketing material. The questions that matter include whether emotional state is a structured select field or a free text entry, whether the platform generates any analytics that cross-reference emotional state data against performance outcomes, whether there is a dedicated review template or workflow for the qualitative psychological layer alongside the quantitative performance data, and whether the platform’s design actively encourages post-trade reflection or treats it as optional.
TradingJournalReviews.com reviews and compares leading trading journal platforms with specific attention to these psychological tracking features. Each review assesses not just whether a platform includes an emotional state field but how that field is implemented, how the data it captures is used in the platform’s analytics, and whether the overall journal workflow supports the kind of structured psychological review practice that produces measurable improvement over time.
For traders who have read this article and want to move from understanding the methodology to implementing it in a tool that genuinely supports it, TradingJournalReviews.com provides the comparative information needed to make that choice without committing time and money to a platform that looks capable on paper but falls short in the specific area that matters most for psychological development work.
Frequently Asked Questions
How do I track emotions in a trading journal?
Record your emotional state at three specific points in every session: once before the session begins as a baseline, once at the moment of entry for each trade, and once immediately after each trade closes. Use a fixed list of emotional labels rather than free text so the data is consistent and filterable across entries. Keep each recording to a single word or short phrase and complete it in real time rather than reconstructing it from memory later. The three-point recording system and a fixed emotional vocabulary are the two practices that turn emotional tracking from a vague intention into an analysable data set.
Can a trading journal help with revenge trading?
Yes, and it is one of the most effective tools available for addressing it. A journal identifies the revenge trading pattern by making the sequence visible: a loss followed by one or more trades logged with frustrated or revenge as the emotional state, typically at a larger than standard position size and a lower than average process quality rating. Once the pattern is confirmed in the data and its financial cost is calculated, it provides the evidence needed to justify a structural rule change, such as a mandatory cooling-off period after a loss of a defined size, that interrupts the cycle before it plays out rather than relying on willpower in the moment.
What emotional states should I record in my trading journal?
Use a fixed list that covers the full range of states most traders experience. A practical set includes calm, confident, anxious, frustrated, euphoric, impatient, bored, distracted, tired, revenge, FOMO, and uncertain. The list does not need to be exhaustive. It needs to be consistent across every entry so that each label appears with the same meaning throughout the journal and can be filtered and grouped meaningfully during review. If you are using a digital journal, configure emotional state as a select property with these options so the field cannot contain anything outside the defined vocabulary.
How do I use my trading journal to identify bad trading habits?
Run three specific analyses during your weekly and monthly review sessions. First, filter entries by emotional state at entry and compare the aggregate outcome of each emotional group against your overall trading average. Second, look at trade sequences rather than individual entries to identify patterns like revenge cycles and overconfidence escalation that are invisible in isolation. Third, filter by time of entry and trade number within the session to identify whether overtrading or below-criteria entries are concentrated in specific windows. Each of these analyses surfaces a specific category of bad habit in your own data rather than in generic advice about what traders typically do wrong.
What is the difference between tracking outcomes and tracking process quality?
Outcome tracking records whether a trade made or lost money. Process quality tracking records whether the trade followed the plan correctly, independently of what the market did with it. The distinction matters because outcomes contain randomness in the short term and cannot reliably distinguish between a good decision that produced a bad result and a bad decision that produced a good result. Process quality ratings remove this ambiguity. A trade rated high on process quality that produces a loss is still evidence that the strategy has edge, because the decision was sound. A trade rated low on process quality that produces a profit is still evidence of a problem, because the result does not validate the decision. Comparing process quality ratings against outcomes across a large sample tells you whether your results are driven by strategy or execution, which is the most important diagnostic question a trader can ask.
How often should I review the psychological layer of my trading journal?
At three different frequencies serving three different purposes. The daily post-session review takes ten minutes and focuses on which emotions were present, whether any rules were broken and in what emotional state, and what to carry forward into the next session. The weekly pattern review dedicates a specific portion of the broader weekly review to psychological trends across the full week’s entries, trigger events, and whether the previous week’s intentions were followed. The monthly psychological audit analyses whether specific emotional patterns are improving or worsening over time and sets the psychological priorities for the coming month. All three layers are necessary because each operates at a time horizon that reveals patterns invisible at the other two.
Can journaling actually change my trading behaviour?
Yes, but not automatically and not quickly. The journal creates the data and the review process creates the insight, but behaviour change requires a third step: translating insight into a specific structural rule that interrupts the identified pattern before it plays out. A trader who identifies the revenge trading pattern in their journal but makes no rule change will see the same pattern repeat. A trader who identifies it and implements a mandatory cooling-off period after a defined loss will see the pattern reduce in frequency and cost over the following months. The journal is the diagnostic tool. The rule change is the intervention. Both are required for behaviour to actually change, and the monthly audit is the measurement that confirms whether change is occurring.
What trading journals have built-in psychology tracking features?
Platforms vary significantly in how well they support psychological tracking. Some include dedicated emotional state fields with fixed vocabulary, process quality ratings, and analytics that cross-reference emotional data against performance outcomes. Others offer only a free text notes field that cannot be filtered or analysed. TradingJournalReviews.com reviews leading trading journal platforms with specific attention to their psychological tracking features, covering how emotional state fields are implemented, what analytics they feed into, and whether the overall journal workflow supports structured psychological review. It is the most practical starting point for identifying which platforms genuinely support the methodology described in this article.
How do I know if my losses are caused by psychology or strategy?
The process quality rating system is the most direct tool for answering this question. Filter your journal for all trades rated at the highest process quality score, meaning trades that met all entry criteria, were sized correctly, and were managed according to plan. Calculate the aggregate outcome of these trades separately from your overall trading outcome. If your high process quality trades are profitable on average and your overall results are not, the losses are being generated by low-quality execution rather than by a flawed strategy. If your high process quality trades are also producing losses on average across a sufficient sample, the strategy itself needs examination. This analysis separates the two causes cleanly and points the development work in the right direction.
Should I record emotions even when I follow my trading plan perfectly?
Yes, always. Recording emotional state only on trades where something went wrong creates a biased data set that cannot support meaningful analysis. The value of emotional tracking comes from comparing emotional states across all trades, not just the problematic ones. A calm baseline state recorded consistently across your best-executed trades is as important as a frustrated state recorded on a revenge entry, because it establishes what your optimal psychological condition looks like and gives you something to compare against. Additionally, logging emotional state on well-executed trades occasionally surfaces a surprising finding: that a specific positive emotional state, such as confident or euphoric, actually precedes below-average outcomes when it appears in excess, which the data can only show if that state is recorded consistently across all entries rather than selectively on the bad ones.