Most traders who keep a trading journal never actually improve from it. They log their trades consistently, record their entry and exit prices, note their profit and loss, and then move on to the next session without doing anything meaningful with the data they have collected. The journal grows longer but the results stay the same, and after a few months the journaling habit fades because it does not seem to be making any difference. The problem is almost never the journal. The problem is that recording trades and analysing trades are two completely different activities, and most traders only do the first one.
Journaling without self-analysis is record-keeping. It has the same relationship to improvement that taking photographs has to actually remembering something. The data is there, but nothing useful happens with it unless there is a structured process for going back, reviewing what it shows, and drawing conclusions that change how you trade going forward. That structured process is what separates traders who improve consistently from traders who repeat the same mistakes across hundreds of trades while wondering why their results are not changing.
This guide is a practical, step-by-step resource for traders who already journal or are starting to journal and want to turn that data into actionable insights that drive real and measurable improvement. If you are still in the early stages of setting up your journaling process, our Complete Trading Journal Guide covers everything you need to get started from scratch. This guide picks up from there, covering how to conduct structured weekly and monthly trade reviews, what to look for in your performance data, how to identify behavioural patterns that are costing you money, how to use self-analysis to refine your strategy, and how to build a review habit that is sustainable over the long term rather than something you do once after a bad month and then abandon.
If you have been journaling without seeing improvement, this guide is where to start.
Key Takeaways
This guide covers the complete trading self-analysis process from weekly trade reviews through to quarterly behavioural audits, giving you a structured framework for turning your journal data into consistent, measurable improvement.
- Most traders journal without ever conducting structured self-analysis, which is why journaling alone rarely produces improvement.
- Trading self-analysis involves reviewing performance data, identifying behavioural patterns, and making specific strategy and process changes based on what the data shows.
- A structured review process operating at weekly, monthly, and quarterly intervals is the most effective way to extract consistent improvement from journal data.
- The most important things to look for in your trade data are setup-specific performance, session and time of day patterns, holding time analysis, and the financial cost of recurring mistakes.
- The right journal tool makes self-analysis significantly easier, with platforms like SuperTrader automating much of the behavioural pattern recognition through AI-driven insights.
- Self-analysis is a habit, not an occasional activity, and building it into a fixed and consistent routine is what separates traders who improve steadily from those who plateau.
What Is Trading Self-Analysis?
Trading self-analysis is the structured process of reviewing your trade history, performance data, and behavioural patterns to identify what is working, what is not working, and what specific changes will improve your results over time. It is the step that sits between keeping a journal and actually getting better at trading, and it is the step that most traders skip entirely or approach without a consistent framework that makes the review process repeatable and useful.
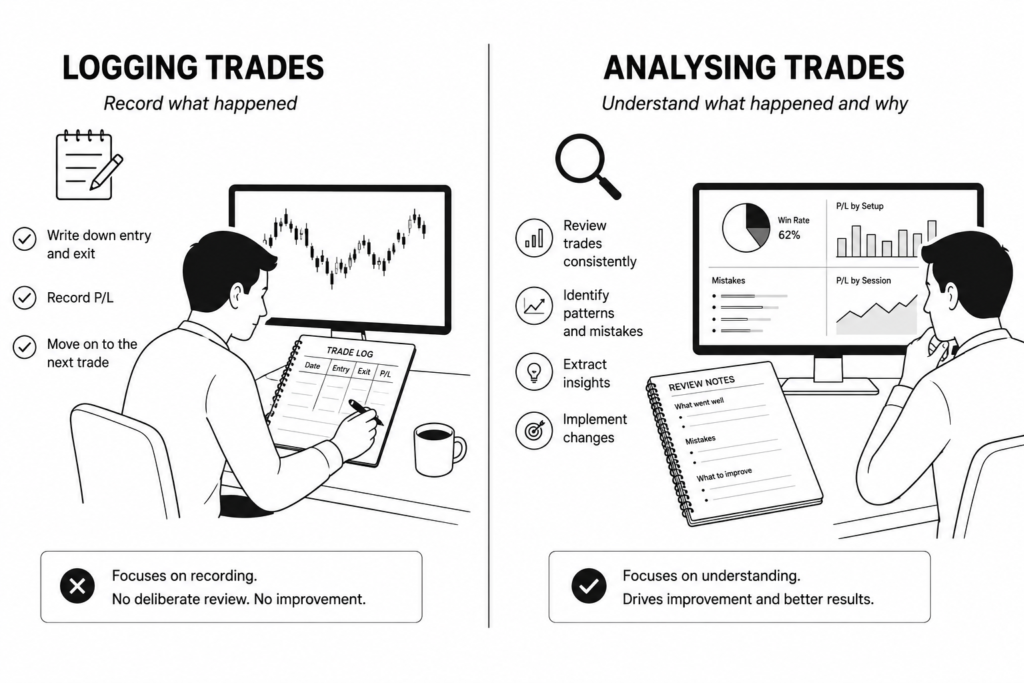
The distinction between passive journaling and active self-analysis is important and worth being clear about. Passive journaling is the act of recording what happened. You log your trades, note your entry and exit, record your profit or loss, and move on. The data exists but nothing is done with it. Active self-analysis is the act of interrogating that data with specific questions, looking for patterns across a meaningful sample of trades, connecting performance outcomes to the conditions and behaviours that preceded them, and drawing conclusions that feed directly into how you trade going forward. One is an archive. The other is a development process.
The reason active self-analysis is where the real improvement happens is straightforward. Trading mistakes are almost never random. They cluster around specific conditions, emotional states, times of day, instruments, or setup types that repeat themselves across a trader’s history in patterns that are invisible trade by trade but become clear when reviewed across a larger sample. A trader who reviews individual trades in isolation will see individual results. A trader who conducts structured self-analysis across fifty or one hundred trades will see the patterns that are actually driving those results, and that is the information that makes meaningful change possible.
Why Most Traders Never Improve From Their Journal
The gap between traders who improve consistently and traders who plateau despite journaling is rarely about effort or intention. Most traders who keep a journal do so because they genuinely want to get better. The gap is almost always about process, and the same process failures appear repeatedly across traders at every level of experience.
The first and most common failure is logging trades without reviewing them consistently. A journal that is written into but never read back is not a development tool. It is a diary. The act of logging a trade takes two minutes. The act of reviewing what that trade reveals about your patterns, your decision-making, and your execution quality is where the value actually lives, and it requires dedicated time set aside for that specific purpose rather than a vague intention to look back at it sometime.
The second failure is reviewing results without a structured framework. Many traders do periodically go back through their journal, but they do so without a consistent set of questions guiding what they are looking for. An unstructured review tends to focus on the most recent trades, the most emotionally significant losses, or whatever catches the eye first. This produces observations rather than insights, and observations without a framework for connecting them to patterns and actions rarely change behaviour.
The third failure is focusing exclusively on profit and loss rather than process and behaviour. Profit and loss is an outcome. It tells you what happened but not why it happened or what to do differently. Traders who evaluate their performance purely through the lens of whether they made or lost money miss the process-level information that is the only thing they can actually control and improve. A trade can be executed perfectly and still lose money. A trade can be executed badly and still make money. Evaluating only the result and ignoring the process produces no useful information for improvement.
The fourth failure is not tracking the right variables to surface meaningful patterns. If a journal records only entry price, exit price, and profit or loss, the data it contains is too thin to reveal anything useful about why performance looks the way it does. Setup type, session, instrument, emotional state, setup quality rating, and mistake tags are the variables that allow patterns to emerge from the data. Without them, a journal review is an exercise in looking at numbers rather than understanding what is driving them.
The fifth failure is emotional resistance to honest self-assessment. Reviewing your own trading honestly requires acknowledging mistakes, accepting that certain beliefs about your edge may not be supported by the data, and confronting patterns that are uncomfortable to see. Many traders approach their journal review with a confirmation bias that leads them to rationalise poor trades rather than learn from them, which makes the review process feel productive while producing no actual change.
Having the right journal tool matters and can make the self-analysis process significantly more accessible, particularly platforms that automate pattern recognition and surface insights without requiring the trader to conduct all the analysis manually. But no tool compensates for the absence of a genuine commitment to the review process itself. The journal is only as useful as the attention brought to it.
The Trading Self-Analysis Framework
A self-analysis process that runs at three different time intervals produces significantly better results than one that operates at a single frequency. Weekly reviews catch execution issues while they are fresh. Monthly reviews surface patterns that are invisible week by week.
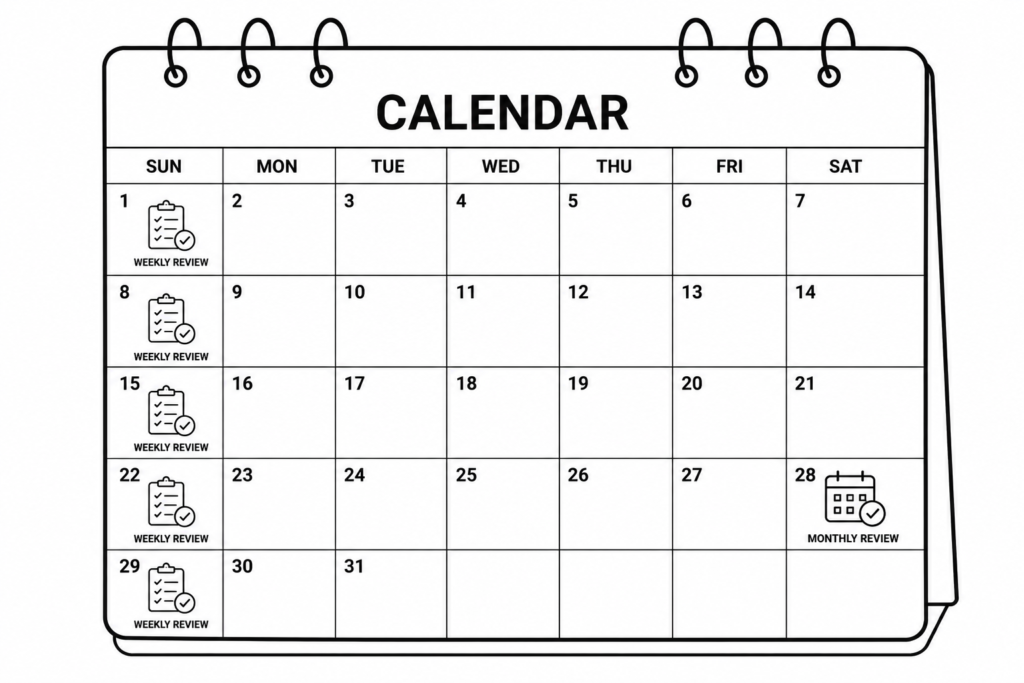
Quarterly audits reveal the deeper behavioural tendencies that monthly snapshots miss. Each level builds on the one below it, and together they create a complete picture of what is driving performance and what needs to change.
Step One: Weekly Trade Review
The weekly trade review is the foundation of the self-analysis process and should be conducted at the same time every week without exception. Sunday evening or Monday morning before the new trading week begins works well for most traders because it closes one week cleanly and sets a clear intention for the next one.
Start by going through every trade logged during the week without skipping any. The temptation to focus on the biggest winners and losers is natural but counterproductive. Unremarkable trades often contain the most useful information about default behaviours and habitual patterns that operate below the level of conscious attention.
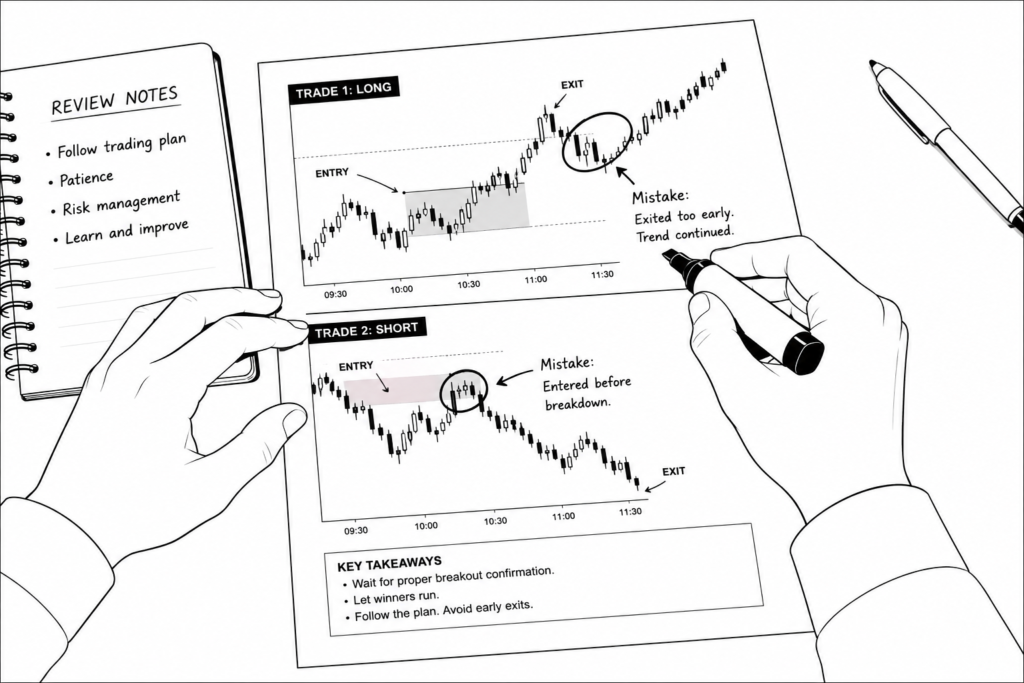
For each trade, assess execution quality against your plan independently of the outcome. Ask whether the entry met your criteria, whether the position size was correct, whether the stop was placed according to your rules, and whether the exit was taken at the right point or whether it was influenced by emotion rather than plan. A trade that lost money but was executed perfectly according to the plan is a good trade. A trade that made money but deviated from the rules is a bad trade that happened to work out, and treating it as a success reinforces the wrong behaviour.
Identify every trade that deviated from your rules and record specifically why the deviation happened. Was it impatience before a setup fully formed? Was it a revenge trade taken after a loss? Was it an oversized position driven by overconfidence after a winning streak? The reason matters more than the deviation itself because the reason points to the specific psychological or process failure that needs to be addressed.
Note your emotional state during the key trades of the week, particularly around any significant losses, any rule breaks, and any moments where you felt the urge to deviate from your plan but held to it. Emotional state data is only useful if it is recorded honestly and consistently rather than selectively noted when things go wrong.
Close the weekly review by recording one to three specific observations from the week’s data. These should be concrete and specific rather than general. Not “I need to be more disciplined” but “I entered two trades before the setup was confirmed during the Tuesday morning session and both were losers.” Specific observations create specific targets for the following week.
Step Two: Monthly Performance Review
The monthly performance review sits above the weekly review and looks for patterns across the full month’s data that are not visible at the weekly level. It should be conducted at the end of each month and should take longer than the weekly review, typically between one and two hours depending on trade volume.
Begin with the quantitative layer. Review your win rate, average R-multiple, and Profit Factor for the month and compare them against your previous months and your long-term benchmarks. Look at the direction of your equity curve over the month and note whether it reflects consistent execution or a pattern of strong starts followed by drawdown, which is one of the most common signals of an emotional discipline issue that shows up clearly at the monthly level but is easy to miss week by week.
Move from overall statistics to setup-specific performance. Identify your best and worst performing setups over the month by win rate and average R-multiple independently, not combined. A setup with a high win rate but a poor average R-multiple may be less valuable than it appears. A setup with a lower win rate but a strong average R-multiple may be more valuable than its win rate suggests. Understanding the statistical profile of each individual setup is the only way to make informed decisions about where to focus your attention and where to reduce or eliminate exposure.
Look for session and instrument-specific patterns across the month’s data. Note whether your morning session consistently outperforms your afternoon session, whether certain instruments are producing results that differ significantly from your overall performance, and whether there are specific days of the week where your results are consistently weaker. These patterns rarely show up clearly in a single week but become visible when reviewed across a full month of data.
Close the monthly review by setting one to three specific improvement targets for the following month based directly on what the data has shown. These targets should be process-based rather than outcome-based. Not “make more money next month” but “reduce the number of trades taken outside my confirmed setup criteria from six to two.” Process targets are within your control. Outcome targets are not.
Step Three: Quarterly Behavioural Audit
The quarterly behavioural audit is the deepest level of the self-analysis framework and addresses the psychological and behavioural patterns that operate across a long enough time period that they cannot be seen clearly in weekly or monthly reviews. It should be conducted at the end of every three-month period and treated as a significant dedicated session rather than a routine review.
Start with your mistake tags. Pull every trade that was tagged as a rule deviation or specific mistake type across the quarter and calculate the exact financial cost of each error category over that period. The total cost of revenge trading across three months, or the cumulative loss from trades taken outside your confirmed setup criteria over a full quarter, is a number that carries significantly more weight than the same observation made about a single week. Quantifying the financial impact of specific behavioural mistakes is one of the most effective ways to create genuine motivation for change because it replaces a vague awareness that mistakes are happening with a concrete understanding of exactly what they are costing.
Review whether the monthly improvement targets set during each of the three monthly reviews were met, partially met, or missed, and assess honestly why the outcome was what it was. A pattern of setting targets and consistently missing them points to either targets that are unrealistic or a deeper behavioural issue that surface-level targets are not addressing. A pattern of meeting targets consistently points to a self-analysis process that is working and should be maintained and built on.
Review your mental state data against your performance outcomes across the quarter. Look for correlations between specific mental state conditions and trading results. If your data shows that trades taken when stress was logged as high consistently underperform trades taken when stress was logged as low, that is not an interesting observation. It is an actionable instruction about the conditions under which you should be reducing size or stepping away from the market entirely.
Close the quarterly audit by identifying the single biggest behavioural pattern that is holding your performance back across the full three-month period. Not a list of things to work on but one specific pattern that the data points to most clearly as the primary drag on your results. Focusing improvement effort on one significant pattern at a time produces more meaningful change than spreading attention across multiple smaller issues simultaneously.
What to Look For in Your Trade Data
Knowing that self-analysis matters is not enough. The more practical question is what to actually look for when you sit down with your journal data. Most traders who attempt a review without a specific agenda end up looking at their overall win rate and equity curve, drawing a general conclusion about whether the month was good or bad, and stopping there. The variables that actually explain why performance looks the way it does sit one level deeper, and finding them requires knowing where to look.
Setup Performance Patterns
Overall win rate is one of the least useful statistics in a trading journal because it aggregates performance across all setups into a single number that obscures more than it reveals. A trader with a 55 percent overall win rate may have one setup running at 72 percent and another running at 31 percent, and the average of those two numbers tells you nothing useful about what to do with either of them. The 72 percent setup deserves more focus and potentially more size. The 31 percent setup deserves serious scrutiny and possibly elimination from the trading plan entirely. But you cannot see either of those conclusions in the overall number.
Analysing performance by individual setup requires tagging every trade to a specific setup type at the point of logging and then pulling the statistics for each setup independently across a meaningful sample size. Win rate, average R-multiple, Profit Factor, and average holding time should all be reviewed separately for each setup rather than in aggregate. What this analysis typically reveals is that a trader’s overall results are being driven by one or two setups that are genuinely profitable while several others are at best break-even and at worst consistently losing. Isolating setup performance changes what a trader should focus on because it replaces a general instruction to trade better with a specific instruction to trade more of what is working and less of what is not.
Session and Time of Day Patterns
Performance variation across sessions and times of day is one of the most consistently revealing patterns in a trading journal and one of the least examined by most traders. The assumption that your edge applies equally across all hours of the trading day is rarely supported by the data, and reviewing session-specific performance often surfaces significant variation that has a direct and actionable implication for how and when you should be trading.
To identify session patterns, segment your trade data by the time of day or session during which each trade was opened and review the key performance metrics for each segment independently. What the data frequently shows is that a trader performs well during one session and significantly worse during another, often a session they continue trading out of habit or availability rather than because their edge is present there. When the data reveals a session or time period that is consistently underperforming across a meaningful sample, the response should be straightforward. Reduce or eliminate trading during that period and concentrate activity in the sessions where the data shows a genuine and consistent edge. This is one of the simplest and most impactful changes a trader can make based on self-analysis because it does not require changing the strategy, only the schedule.
Instrument Specific Performance
Most traders develop a view of themselves as having an edge in a particular market or instrument based on familiarity and experience rather than data. Self-analysis frequently challenges that view by revealing significant variation in performance across instruments that the trader had not previously examined at this level of granularity.
Assessing instrument-specific performance requires segmenting trade data by the instrument or market on which each trade was taken and reviewing win rate, average R-multiple, and Profit Factor for each instrument independently. The pattern that emerges from this analysis is often surprising. Traders who consider themselves forex traders may find that two or three currency pairs are driving all their profitable results while several others they trade regularly are consistently unprofitable. Traders who trade across multiple asset classes may find that their edge exists clearly in one market and not at all in another they have been trading with equal confidence.
The reason traders continue trading instruments where their edge does not exist is almost always that they have not looked at the data at this level. Once the data is in front of them the conclusion is unavoidable. Eliminating or significantly reducing exposure to instruments where the data shows no consistent edge is one of the most direct paths to improving overall performance without changing anything about how a trader approaches the instruments where the edge is real.
Holding Time Analysis
Cutting winners short and holding losers too long is one of the most common and costly behavioural patterns in retail trading, and it is one that traders frequently underestimate in their own performance because it is difficult to see without analysing holding time data systematically across a large sample of trades.
Holding time analysis involves comparing average holding time against trade outcome across the full trade history to identify whether a systematic pattern exists. What the data typically reveals is one of two things. Either winning trades are being closed significantly earlier than losing trades, which indicates that the trader is applying asymmetric emotional pressure to their positions by taking profit quickly to lock in a gain while allowing losses to run because closing them requires accepting that the trade was wrong. Or losing trades are being held well beyond the point at which the original thesis was invalidated, which points to the same emotional pattern operating at the exit rather than the entry.
Understanding this pattern through data rather than through general self-awareness is important because it quantifies the behaviour in a way that makes it impossible to rationalise. A trader who knows abstractly that they sometimes cut winners short will treat it as an occasional issue. A trader whose data shows that their average winning trade is closed after forty minutes while their average losing trade runs for two hours and twenty minutes is looking at a systematic and costly pattern that the data makes impossible to dismiss.
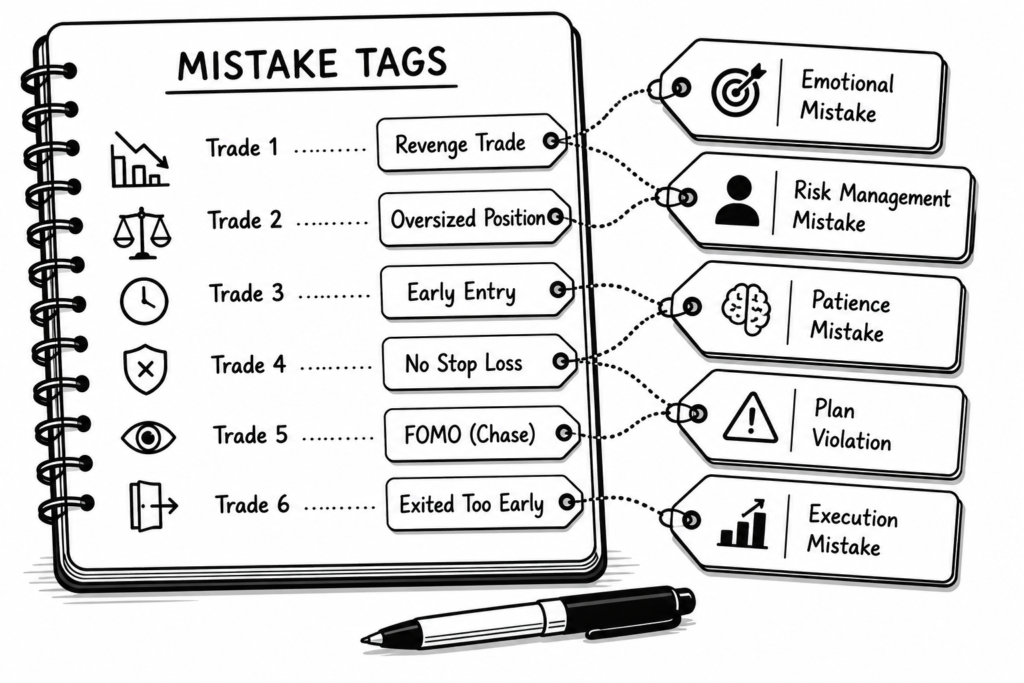
Mistake Frequency and Cost
Tagging trades with specific mistake types at the point of logging or review is one of the most valuable habits a trader can build into their journaling process, and calculating the cumulative financial cost of each mistake type over a defined period is one of the most motivating forms of feedback available in self-analysis.
The process is straightforward. Define a set of mistake categories that reflect the specific rule breaks most relevant to your trading, such as revenge trading, entering before a setup is confirmed, sizing above plan, holding a loser beyond the stop, or exiting early out of anxiety. Tag every trade where one of these mistakes occurred with the relevant category and note the financial result of that trade. At the end of each quarter, sum the total cost of each mistake category across all tagged trades.
The number that results from this calculation carries a weight that no amount of general awareness about the same mistakes produces. A trader who knows they revenge trade occasionally will continue to treat it as an occasional problem. A trader whose quarterly review shows that revenge trading cost them a specific and significant dollar amount over three months is looking at a concrete and unavoidable argument for change. Quantifying the cost of specific mistakes transforms self-analysis from a reflective exercise into a financial argument for behaviour change, which is a significantly more effective form of feedback for most traders.
How to Identify Behavioural Patterns in Your Trading
Performance data tells you what is happening. Behavioural analysis tells you why. The move from one to the other is where self-analysis becomes genuinely transformative rather than simply informative, and it requires a different type of question than the ones used to analyse setup performance or session statistics. Instead of asking what the numbers show, behavioural analysis asks what was happening inside the trader when those numbers were being produced.
The starting point for identifying behavioural patterns is the mental state data logged alongside each trade. If your journal records stress levels, sleep quality, confidence, or emotional state at the time of each trade, you have the raw material to connect internal condition to external outcome across a meaningful sample. The analysis is straightforward in principle. Group your trades by the mental state logged at the time and review the key performance metrics for each group independently. What this comparison typically reveals is a performance gap between trades taken in a calm and focused state and trades taken when stress was elevated, confidence was artificially high after a winning streak, or sleep quality was poor. The gap is almost always larger than the trader expected, and seeing it quantified in their own data is a more convincing argument for managing mental state as part of the trading process than any general advice about trading psychology could be.
Identifying the emotional triggers that precede losing streaks requires looking at the trades immediately before a sequence of losses rather than at the losing trades themselves. The trigger is almost never visible in the losing trades because by the time the losses are happening the emotional state that caused them is already fully active. Look at what happened in the session or day before a losing streak began. Was there a larger than usual loss that preceded the streak? Was there a winning run that may have produced overconfidence and oversizing? Was there an external stressor that appears in the mental state log around that time? The pattern that emerges from this analysis across multiple losing streaks in the data reveals the specific conditions that reliably precede a breakdown in performance for that individual trader, which is information that no generic trading psychology advice can provide because it is specific to that trader’s particular emotional profile.
Identifying the conditions under which discipline breaks down requires examining every tagged rule deviation across a meaningful sample and looking for the common factors that were present when those deviations occurred. Rule breaks rarely happen randomly. They cluster around specific conditions that vary by trader but typically include a sequence of losses that triggers revenge trading, a sequence of wins that triggers overconfidence and oversizing, specific times of day when decision-making quality deteriorates, or specific market conditions such as high volatility or low volume that disrupt a trader’s ability to apply their criteria consistently. When the data reveals that eighty percent of your rule deviations occurred in a specific set of conditions, you have identified the specific situation that requires a specific response rather than a general instruction to be more disciplined.
The practical output of this behavioural analysis should be a pre-trade routine and checklist that is built directly from the specific weaknesses the data has identified rather than from generic advice about what good traders do. A checklist built from data might include a check of sleep quality before trading, a rule about reducing position size by fifty percent on any day following a loss above a defined threshold, a hard stop on trading after a defined number of consecutive losses in a single session, or a confirmation requirement that a setup meets all criteria before an entry is taken rather than most of them. Each item on the checklist should be traceable back to a specific pattern identified in the journal data rather than included because it sounds like good practice in general.
This is the point where self-analysis closes the loop between reviewing the past and changing the future. The journal data reveals the pattern. The behavioural analysis identifies the trigger and the condition. The pre-trade checklist translates that insight into a specific rule that addresses the identified weakness at the point in the trading process where it is most likely to occur. A checklist built this way is not a generic reminder to stay disciplined. It is a personalised intervention designed around the specific ways that a particular trader’s discipline breaks down under specific and identifiable conditions.
How to Use Self-Analysis to Refine Your Strategy
Self-analysis without strategy refinement is an incomplete process. The point of identifying what the data shows is not to produce interesting observations about your trading but to make specific and deliberate changes to how you trade going forward. The insights generated through a structured review process have a direct and practical application to strategy refinement, and the path from observation to action is more straightforward than most traders expect once the data is clearly in front of them.
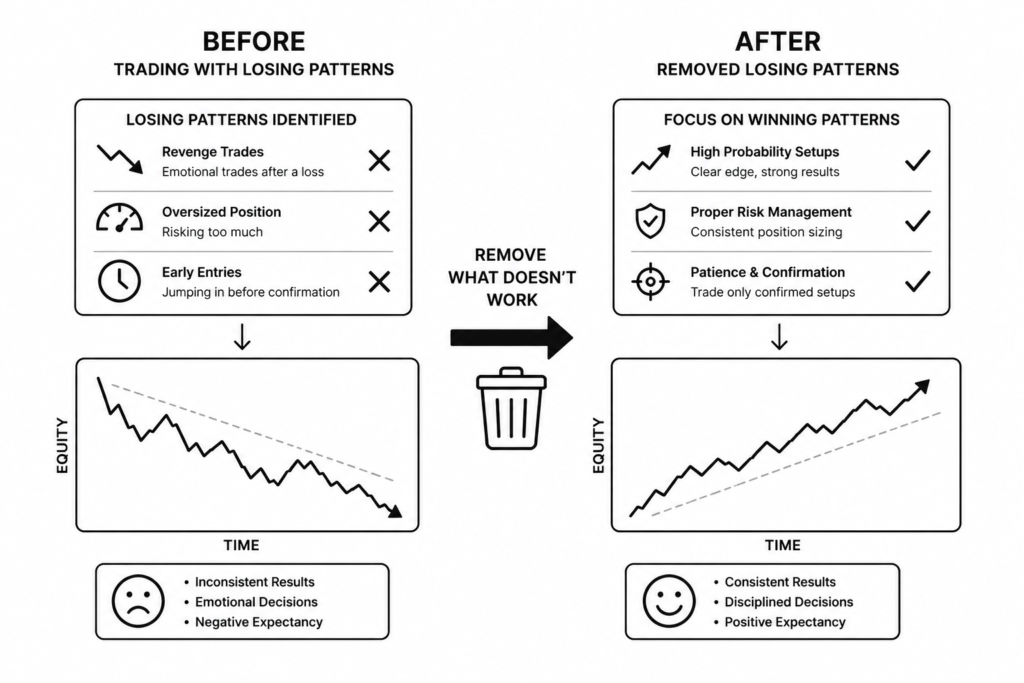
The first and most immediate application is cutting or reducing size on consistently underperforming setups. When setup-specific analysis reveals that a particular trade type has produced a negative expectancy across a statistically meaningful sample, the correct response is not to keep trading it with the intention of improving execution. A setup with genuinely negative expectancy will not become profitable through better execution alone. The options are to eliminate it from the trading plan entirely or to reduce size to the minimum while conducting further analysis to understand whether the underperformance is structural or situational. Either response is more rational than continuing to trade a setup at full size while hoping the results improve without a specific reason to expect they will.
The second application is increasing focus and size on consistently profitable setups. Most traders underweight their best setups because they spread their attention and capital across too many trade types simultaneously. When the data clearly identifies one or two setups that are producing significantly better results than the rest of the plan, the logical response is to concentrate more of the trading activity and more of the risk capital on those setups. This does not require finding new edges or developing new skills. It requires the discipline to follow what the data is already showing and to allocate attention and size accordingly. Traders who make this adjustment based on data rather than intuition almost always see an improvement in overall performance without changing anything fundamental about their approach.
The third application is adjusting session exposure based on time of day performance data. When monthly and quarterly reviews consistently show that performance during a specific session is negative or significantly below the overall average, the strategy adjustment is straightforward. Reduce or eliminate trading during that session and concentrate activity in the periods where the data shows a genuine and consistent edge. This is one of the simplest strategy modifications available because it does not require changing the trading approach at all, only the hours during which it is applied. A trader who eliminates two hours of consistently unprofitable trading from their day has effectively improved their strategy without changing a single entry or exit rule.
The fourth and most important application before implementing any significant strategy modification is backtesting the change against historical data before applying it live. Self-analysis identifies what the current approach is producing and points toward specific modifications that might improve it, but it does not validate those modifications. A setup that has underperformed over the last three months may have performed differently under different market conditions. A session that has been consistently unprofitable recently may reflect current market conditions rather than a permanent absence of edge during that time period. Before cutting a setup, increasing size on another, or restructuring session exposure in a significant way, testing the modified approach against a broader historical sample gives you a basis for confidence in the change that live trading alone cannot provide.
The relationship between self-analysis and strategy refinement should be continuous rather than occasional. Each quarterly behavioural audit should produce at least one specific strategy modification based on what the data has shown. Each modification should be tested before it is implemented at full scale. Each implemented change should be tracked through the ongoing review process to assess whether it is producing the expected improvement. Over time this creates a compounding refinement process where the strategy becomes progressively more aligned with what the data shows actually works for that specific trader in the markets they trade, which is a more reliable path to consistent improvement than seeking external solutions to performance problems that the journal data already contains the answers to.
The Role of Trading Journal Tools in Self-Analysis
The self-analysis process outlined in this guide can be applied using any journal tool, including a well-structured spreadsheet, and the framework itself is more important than the platform used to implement it. That said, the right journal tool makes self-analysis significantly easier, more consistent, and more likely to surface insights that manual review would miss, and the difference between a basic logging tool and a purpose-built analytical platform becomes most apparent at exactly the point where self-analysis matters most.
The primary way that journal tools improve the self-analysis process is by reducing the analytical burden on the trader. Segmenting trade data by setup, session, instrument, and mental state manually across hundreds of trades is time-consuming and prone to error. A platform that handles that segmentation automatically and presents the results in a clear and structured format removes the friction that causes many traders to skip the deeper levels of analysis during their review sessions. When the data is already organised and the patterns are already partially visible, the review process takes less effort and produces better results.
Platforms like SuperTrader go further by automating much of the pattern recognition process entirely through AI-driven behavioural analysis. Rather than requiring the trader to know what to look for and how to find it in their data, SuperTrader’s AI Mentor works across the logged trade history to identify behavioural leaks, quantify the financial cost of specific mistake types, and surface session and instrument-specific performance patterns that the trader may not have thought to examine. For traders who want the benefits of deep self-analysis without the analytical infrastructure to conduct it manually, this kind of automated insight generation closes the gap between having data and understanding what it means. You can read a full independent assessment of SuperTrader and how its AI features support the self-analysis process at TradingJournalReviews.com.
For traders who have the quantitative mindset and the analytical inclination to conduct their own deep analysis, platforms like TradesViz provide the custom reporting tools and multi-dimensional filtering capabilities to interrogate trade data at a level of granularity that most journals do not support. The ability to build custom dashboards, apply filters across multiple variables simultaneously, and generate reports that reflect the trader’s own analytical priorities rather than a standardised set of metrics makes TradesViz particularly well suited to traders who want maximum control over how they conduct their self-analysis rather than having the platform decide what is relevant. A full review of TradesViz and its analytical capabilities is available at TradingJournalReviews.com.
The practical implication for traders choosing a journal tool is that the platform should match the type of self-analysis they intend to conduct. A trader who wants guided insights and automated pattern recognition will get more from SuperTrader. A trader who wants to build their own analytical framework and conduct granular multi-variable analysis will get more from TradesViz. A trader who needs deep broker integration alongside solid analytical tools will find TraderSync or TradeZella more relevant. For a full comparison of the leading trading journal platforms across features, pricing, integrations, and self-analysis capability, visit TradingJournalReviews.com where each platform is assessed independently so you can match the right tool to how you actually intend to use it.
What matters most, regardless of which platform a trader uses, is that the self-analysis process described in this guide is applied consistently and with genuine commitment to following where the data leads. The best journal tool in the market produces no improvement for a trader who logs trades without reviewing them. A basic spreadsheet used with discipline and a structured weekly, monthly, and quarterly review process will produce more meaningful improvement than a sophisticated platform used casually. The tool supports the process. It does not replace it.
Common Self-Analysis Mistakes to Avoid
Understanding the self-analysis process is one thing. Executing it without falling into the patterns that undermine its value is another. The mistakes that follow are not theoretical. They are the specific ways that traders with genuine intentions toward self-improvement consistently compromise the quality of their own review process, often without realising it.
The first mistake is reviewing too infrequently to spot meaningful patterns. Self-analysis conducted once every few months after a particularly bad period is not a development process. It is a reaction to pain. Patterns in trading data accumulate gradually and become visible only when reviewed consistently across a sufficient time period with enough regularity that the signal can be separated from the noise. A trader who reviews monthly will see things that a trader who reviews quarterly misses entirely. A trader who reviews weekly will catch execution issues while they are fresh and actionable rather than after they have compounded across weeks of repeated behaviour. Frequency is not optional in self-analysis. It is the mechanism by which the process works.
The second mistake is focusing on recent results rather than statistically significant sample sizes. Recent results carry disproportionate emotional weight and disproportionately influence how traders interpret their performance data. A strong two-week run following a difficult month is not evidence that the strategy has improved. A poor two-week run following a strong month is not evidence that the edge has disappeared. Trading performance is inherently noisy over short periods, and drawing conclusions from samples that are too small to be statistically meaningful produces false confidence during good runs and unnecessary alarm during bad ones. Self-analysis should always be conducted across a sample size large enough to contain a genuine signal, which for most retail traders means a minimum of fifty trades and ideally one hundred or more before any significant conclusions are drawn.
The third mistake is confusing correlation with causation in performance data. When self-analysis reveals that performance is consistently better on Tuesday mornings or consistently worse when a specific instrument is being traded, it is tempting to treat that correlation as a causal explanation and act on it immediately. Correlation in trading data frequently reflects coincidence, market conditions during the period reviewed, or a third variable that has not been identified rather than a genuine and durable causal relationship. Before acting on a correlation identified in journal data, examine whether there is a plausible causal mechanism that explains it, whether the pattern holds across different market conditions and time periods, and whether the sample size is large enough to rule out chance as the explanation. A pattern that appears in thirty trades during a single market regime is not the same as a pattern that appears consistently across two hundred trades over six months of varying conditions.
The fourth mistake is making strategy changes based on too small a sample. This is the action-oriented version of the sample size problem and it compounds the damage that drawing premature conclusions causes. A setup that has produced five consecutive losers has not been proven unprofitable. A session that produced poor results for three weeks during a period of unusual market volatility has not been proven to be outside the trader’s edge. Strategy changes made on the basis of insufficient data introduce new variables into the trading process before the existing variables are properly understood, which makes it progressively harder to identify what is actually driving results. The rule of thumb is that a strategy modification should only be implemented after the pattern justifying it has been observed across a sample size large enough to be statistically meaningful and after the modification has been validated through backtesting against historical data rather than tested live from the first trade.
The fifth and most pervasive mistake is allowing emotional bias to influence how data is interpreted rather than letting the numbers speak. Self-analysis requires a level of honesty that is genuinely uncomfortable because it involves looking at evidence that contradicts how a trader thinks about themselves and their trading. A trader who believes they have an edge in a particular setup will find ways to explain away the data when it shows that setup is unprofitable. A trader who identifies with being disciplined will minimise or rationalise the rule deviations that appear in their mistake tags. A trader who has had a good month will interpret ambiguous data generously. A trader who has had a bad month will interpret the same data pessimistically. Emotional bias in self-analysis does not feel like bias. It feels like reasonable interpretation. The only protection against it is a commitment to following the data wherever it leads regardless of whether the conclusion is comfortable, and a willingness to treat the numbers as more reliable than the narrative about the numbers that the emotional mind is always ready to provide.
Building a Sustainable Self-Analysis Habit
Knowing how to conduct self-analysis and actually doing it consistently are two different problems, and the second one is harder than the first for most traders. The framework, the questions to ask, and the patterns to look for are all learnable. The habit of returning to that framework week after week, month after month, regardless of whether the recent results have been good or bad, requires a different kind of commitment that does not happen by default. It has to be deliberately built into the trading routine in a way that makes skipping it harder than doing it.
The first practical step is scheduling fixed weekly and monthly review sessions in advance and treating them with the same seriousness as a trading session itself. A review that happens whenever there is time available will not happen consistently because there is rarely time available unless it is deliberately protected. Choose a specific day and time for the weekly review and block it in the schedule without exception. Sunday evening works well for most traders because it sits at the natural boundary between one trading week and the next. Choose a specific day at the end of each month for the monthly review and protect that time in the same way. The scheduled time creates the habit. The habit creates the data. The data creates the improvement.
The second step is keeping the review process structured and time-bounded. An open-ended review session with no defined scope and no time limit is easy to avoid because it feels like an indefinite commitment. A weekly review with a defined set of questions to work through and a one-hour time boundary is a manageable and repeatable task. Structure the review around a consistent checklist of questions rather than approaching it as a general reflection on how the week went. Work through the checklist in order, record your observations in a consistent format, and stop when the time is up rather than extending the session indefinitely when something interesting emerges. The discipline of keeping reviews time-bounded and structured is what makes them sustainable over months and years rather than exhausting after a few weeks.
The third step is using a consistent framework rather than approaching each review differently. Consistency in the review process is what allows meaningful comparison across time periods. If the weekly review covers different questions each week depending on what feels relevant in the moment, the observations produced by each review cannot be compared against each other in a way that reveals longer-term patterns. The framework outlined in this guide, covering execution quality, rule deviations, emotional state, and specific observations at the weekly level, and performance metrics, setup analysis, session patterns, and improvement targets at the monthly level, is designed to produce comparable data across review periods precisely because it asks the same questions every time. Resist the temptation to reinvent the review process each time it feels stale. Staleness in a review framework is usually a signal that the observations it is producing are uncomfortable rather than that the framework itself needs changing.
The fourth step is treating self-analysis as a non-negotiable part of the trading process rather than an optional extra that gets skipped when life is busy or results are good. The most common time for traders to skip their review sessions is after a strong month, when the results feel like they speak for themselves and the review feels unnecessary. This is precisely the wrong time to skip a review because strong periods frequently contain the seeds of the overconfidence and rule relaxation that precede drawdowns. The review session after a good month is as important as the review session after a bad one, and treating both with equal seriousness is what separates traders who maintain consistent performance over time from those who cycle between strong periods and the corrections that follow them.
The traders who extract the most value from self-analysis over the long term are not necessarily the ones with the most sophisticated analytical process. They are the ones who show up to their review sessions consistently, work through the same framework with genuine attention each time, record their observations honestly, and follow through on the improvement targets they set for themselves. Self-analysis is not a skill that produces results the first time it is applied. It is a compounding process that produces progressively clearer insight into your own trading as the data set grows, the patterns become more visible, and the habit of honest review becomes embedded deeply enough that it no longer requires effort to maintain. The traders who build that habit early and protect it consistently are the ones whose journals actually make them better.
Frequently Asked Questions
How often should I review my trading journal?
A structured self-analysis process should operate at three frequencies simultaneously. A weekly trade review should be conducted at the same time every week without exception, covering every trade logged during that week while execution and emotional context are still fresh. A monthly performance review should be conducted at the end of each month and looks for patterns across the full month’s data that are not visible at the weekly level. A quarterly behavioural audit should be conducted every three months and addresses the deeper psychological and behavioural patterns that only become clear across a longer time period. Each frequency serves a different purpose and none of them is optional if the goal is consistent and measurable improvement.
What should I look for when reviewing my trades?
The most important things to examine during a trade review are execution quality against the plan rather than outcome, rule deviations and the specific reason each deviation occurred, emotional state during key trades particularly around significant losses and rule breaks, setup-specific performance patterns across the full review period, session and time of day variation in results, instrument-specific performance, holding time relative to outcome, and the frequency and cumulative financial cost of recurring mistake types. Focusing only on profit and loss during a review produces the least useful information because it tells you what happened without telling you why it happened or what to change.
How do I identify my biggest trading mistakes?
The most effective way to identify your biggest trading mistakes is to tag every rule deviation or error type at the point of logging or review using a consistent set of mistake categories that reflect your specific trading rules. Categories might include revenge trading, entering before a setup is confirmed, oversizing, holding a loser beyond the stop, or exiting early out of anxiety. At the end of each quarter, calculate the cumulative financial cost of each mistake category across all tagged trades. The category with the highest total cost is your biggest trading mistake regardless of how frequently or infrequently it occurred. This approach replaces a vague general awareness of what you do wrong with a specific and quantified understanding of what is costing you the most money.
What is the difference between a trade review and a performance review?
A trade review operates at the individual trade level and focuses on execution quality, rule adherence, and the decision-making process behind each specific position. It asks whether each trade was taken and managed according to the plan and what the emotional context was at the time. A performance review operates at the aggregate level and looks at statistical patterns across a full month or quarter of trading data. It asks how specific setups, sessions, and instruments are performing relative to each other and to previous periods, and uses that information to set specific improvement targets and strategy modifications. Both are necessary and they address different questions. The trade review tells you how you executed. The performance review tells you what the cumulative effect of that execution is producing over time.
How long should a weekly trade review take?
For most retail traders trading at moderate volume, a structured weekly trade review should take between forty-five minutes and ninety minutes depending on the number of trades logged during the week. The review should be time-bounded rather than open-ended, which means working through a consistent checklist of questions within the allocated time rather than extending the session indefinitely when something interesting emerges. A review that consistently takes longer than ninety minutes is either covering too many trades for a weekly frequency or lacks enough structure to move through the material efficiently. If the weekly volume is too high for a thorough review within that time frame, sampling the most significant trades and conducting a fuller review at the monthly level is a practical adjustment.
Can self-analysis replace a trading mentor or coach?
Self-analysis and mentoring address overlapping but distinct needs and are most powerful when used together rather than as alternatives to each other. Self-analysis gives a trader access to the specific patterns in their own data that no external observer can see without access to the full trade history, and it builds the self-awareness and analytical discipline that makes a trader a better student when they do work with a mentor. A mentor or coach provides external perspective, pattern recognition across many traders rather than just one, and accountability that self-analysis alone cannot provide because it relies entirely on the honesty and consistency of the trader conducting it. If a choice has to be made between the two, self-analysis applied consistently with a structured framework will produce more improvement than occasional mentoring without an underlying review process, but the combination of both is significantly more effective than either one alone.
What journal tools are best for trading self-analysis?
The best journal tool for self-analysis depends on the type of analysis a trader intends to conduct. For traders who want a guided experience where much of the pattern recognition is automated, SuperTrader’s AI Mentor identifies behavioural leaks, quantifies the financial cost of specific mistake types, and surfaces session and instrument-specific patterns without requiring the trader to conduct all the analysis manually. For traders who want maximum analytical flexibility and the ability to build their own custom reporting framework, TradesViz provides the multi-dimensional filtering and custom dashboard tools that give quantitatively minded traders granular control over how they interrogate their data. For traders who need strong broker integration alongside solid analytical tools, TraderSync and TradeZella are worth evaluating. Full independent reviews of all these platforms are available at TradingJournalReviews.com where each platform is assessed across features, pricing, and self-analysis capability so you can match the right tool to how you actually intend to use it.
How many trades do I need before self-analysis becomes meaningful?
As a general rule, a minimum of fifty trades is needed before setup-specific or session-specific analysis starts to produce conclusions that are statistically meaningful rather than driven primarily by variance. One hundred trades or more is a more reliable sample for drawing conclusions that justify significant strategy changes. This does not mean self-analysis has no value below fifty trades. The weekly trade review process, which focuses on execution quality and rule adherence rather than statistical patterns, is valuable from the very first trade logged because it builds the review habit and produces process-level observations that do not require a large sample to be useful. The threshold of fifty to one hundred trades applies specifically to the pattern recognition and strategy refinement layer of self-analysis where statistical significance matters. Start the weekly review process immediately and begin looking for statistical patterns once the sample size is large enough to support them.